1. Introduction
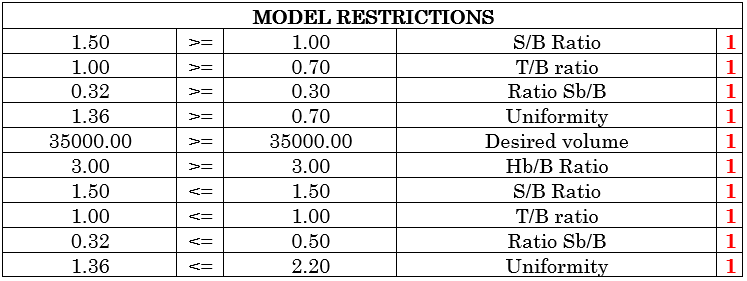
The optimization process aims to minimize the unit cost (€/m3) of the operations that integrate the primary blast, secondary and crushing rock, taking into account pre-established criteria to obtain a lower global cost per m3. In this way, a pseudo-optimal geometry of the blast was generated through the resolution of the model by the Solver Excel tool. And, as expected, this model obeys restrictions with respect to the geometric relations of the blast, granulometry and the characteristics that govern the crusher.
It is worth mentioning that since the kinetic parameters of the crusher model are already optimized, there is no need to change them, except their regulation. More information about the built model will be described in the following topics. Hope you like it.
2. Mathematical model created
In summary, the model created is shown in the figure below, where it is possible to observe the interconnection between the studied parameters that will be integrated into the optimization model, originating geometrical and granulometric parameters of the rock blasting, optimal choice of drilling diameter and close side setting , taking into account the total cost of drilling, amount of explosive to be used, booster, surface connector and energy needed to fragment the material processed by the crusher. As the objective and restrictions result from non-linear functions of the decision variables, it chose to choose the Generalized Reduced Gradient GRG method of the Solver supplement for the optimization of this model.

2.1 Model Feeding
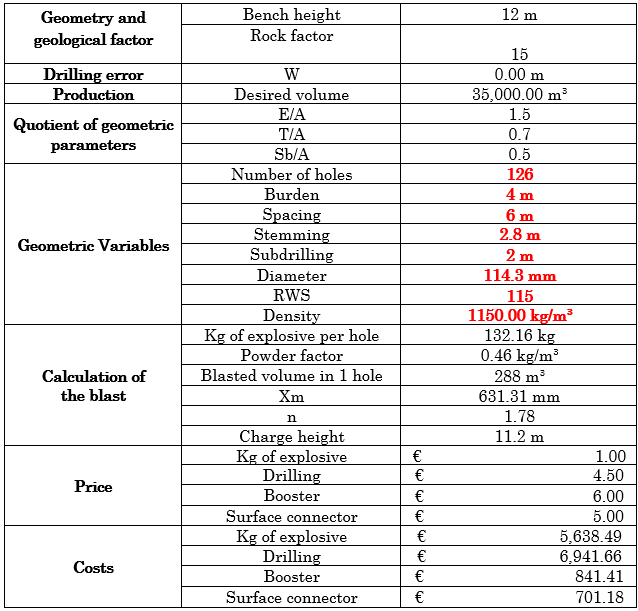
Imagine in an open pit mine exploration that aims to blast 35,000 m3, with a 12 m high bench, rock factor of 15 and drilling error equal to 0.

2.2 Drilling diameter selection
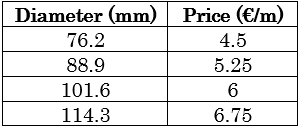
In seeking the best selection of the drilling diameter taking into account its characteristics, the conclusion was reached that the ones that could give better results were the diameters of 76.2 mm, 88.90 mm, 101.60 mm and 114.30 mm, with the costs of 4.5 €/m, 5.25 €/m, 6 €/m and 6.75 €/m respectively.
2.3 Price table
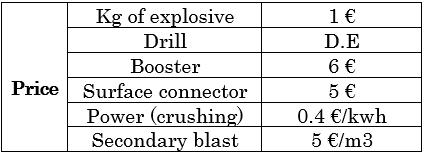
The budget analysis for each of the costs involved in the operations is described below, provided that “D.E.” corresponds to the cost of the diameter chosen by the model:
3. Results
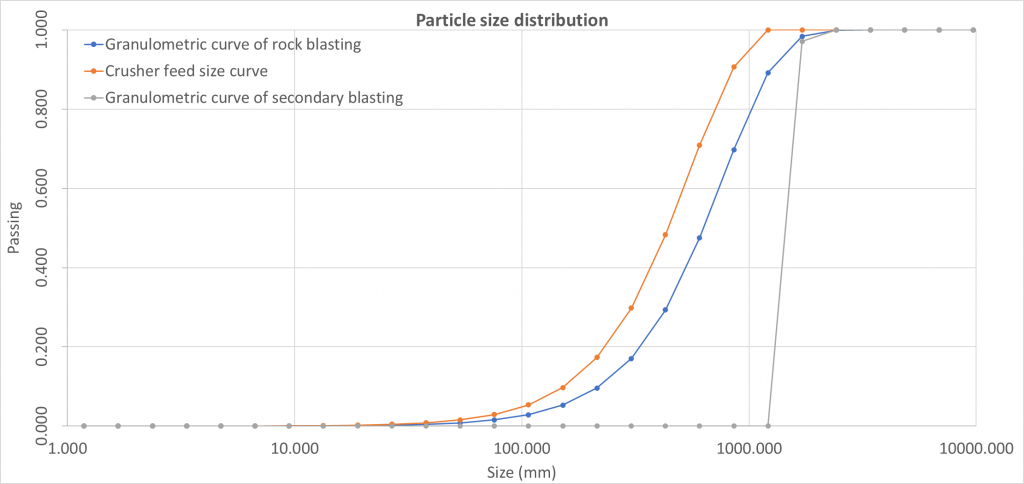
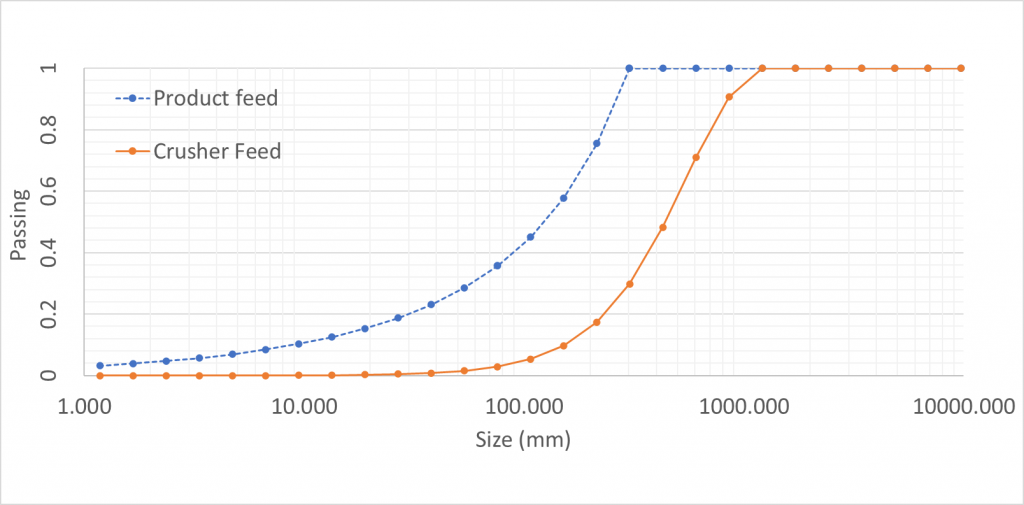
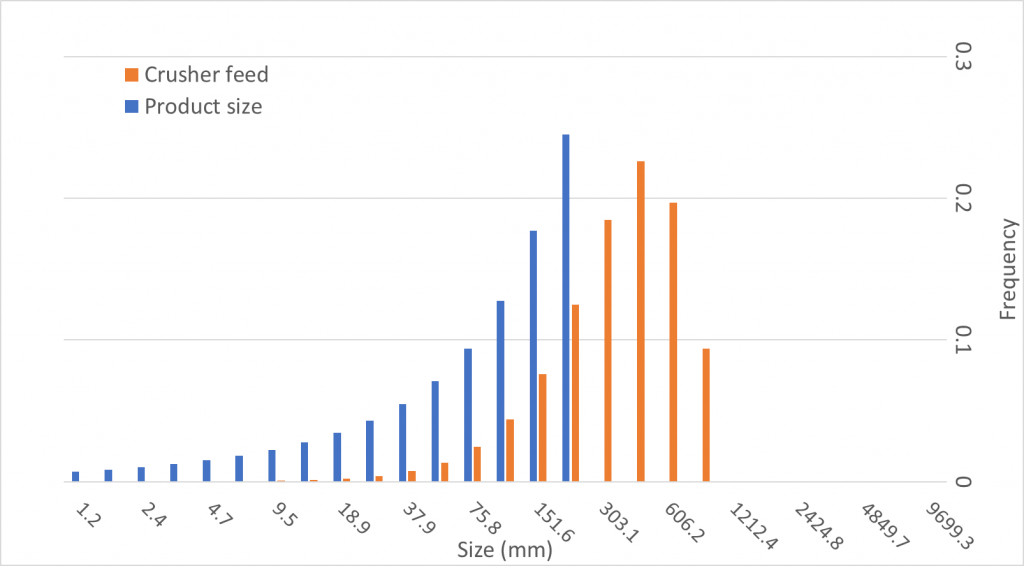
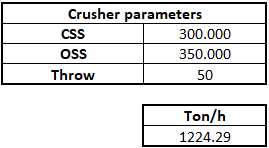
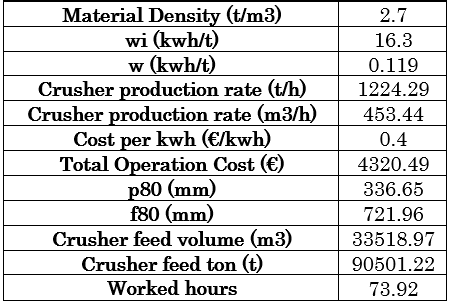
After using the Solver Excel tool for the global unit cost optimization process, the results presented by the model were as follows:



3. Conclusion
Through the results achieved in the model, it is possible to verify that all the retractions and conditions of the optimization process have been satisfied. It should also be noted that considering the complexity and limitations of the model’s decision variables, this may not be the best way to solve the problem, but according to the various variables analyzed, this is definitely the best solution at the local level.
If you want tips on how to make a blast, download our pocket guide:
Stay well guys 😀


